Top 10 States with Highest Violent Crime Rates
Discover the states facing the most severe violent crime challenges, backed by latest FBI data and expert analysis.
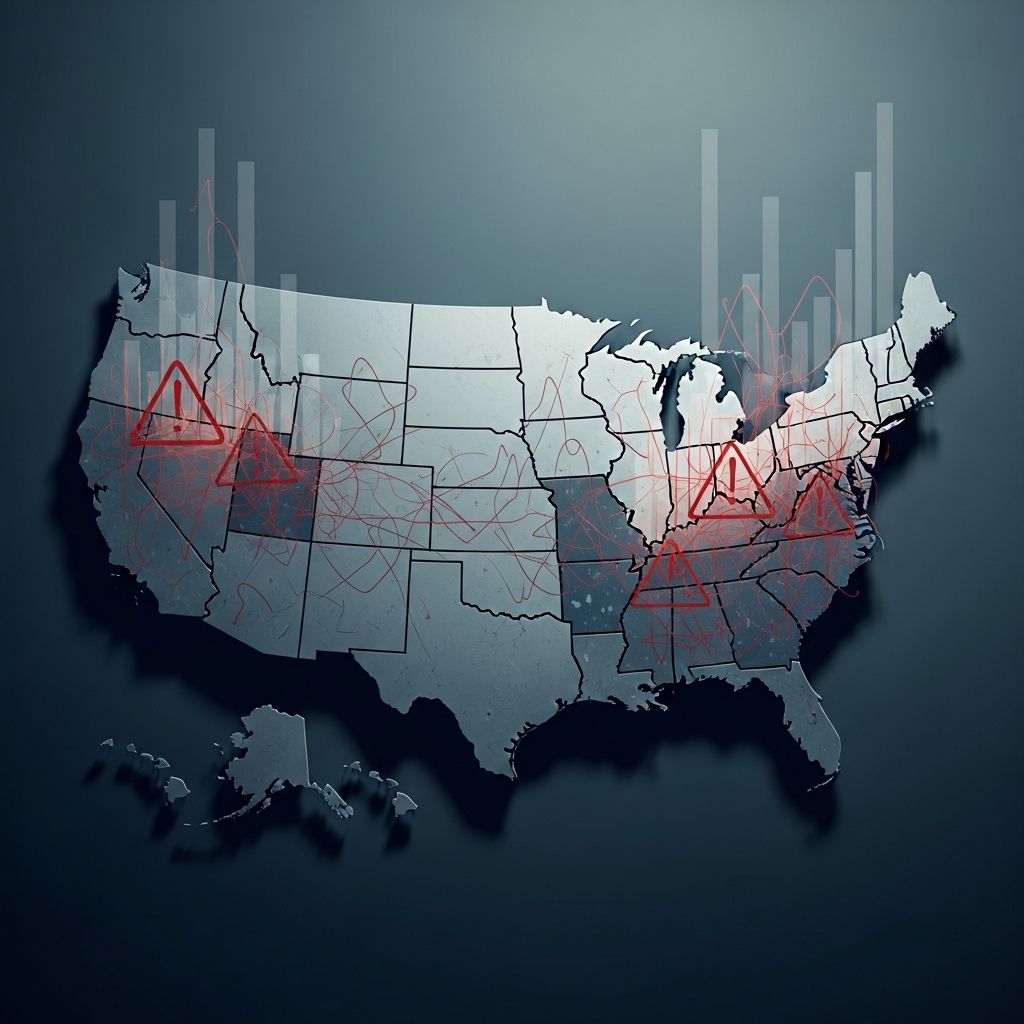
Violent crime remains a pressing concern across the United States, with certain states experiencing disproportionately high rates. Defined by the FBI as offenses involving force or threat of force—including murder, rape, robbery, and aggravated assault—these incidents per 100,000 residents reveal stark regional disparities. In 2024, the national average stood at 359.1, but top states far exceeded this benchmark. This analysis draws from authoritative FBI-derived data to rank the leading 10 states, dissect underlying drivers, and propose evidence-based solutions.
Understanding Violent Crime Metrics
The FBI’s Uniform Crime Reporting (UCR) program standardizes violent crime data, categorizing it into four core types: homicide (murder and non-negligent manslaughter), rape (revised definition post-2013), robbery, and aggravated assault. Rates are calculated per 100,000 population for comparability. Recent trends show a national decline of 5.4% in violent crime from 2023 to 2024, driven largely by drops in homicides, yet high-rate states persist in challenging this progress. Factors like urbanization, economic conditions, and policing efficacy influence these figures.
Ranking the Top 10 States by Violent Crime Rate
Based on 2024 data, here are the states with the highest violent crime rates, presented in a comparative table for clarity:
| Rank | State | Violent Crime Rate (per 100k) | Homicide | Rape | Robbery | Aggravated Assault |
|---|---|---|---|---|---|---|
| 1 | District of Columbia | 1,005.5 | 25.5 | 34.6 | 481.5 | 463.9 |
| 2 | Alaska | 724.1 | 6.9 | 122.1 | 82.0 | 513.0 |
| 3 | New Mexico | 717.1 | 10.5 | 53.8 | 65.3 | 587.5 |
| 4 | Tennessee | 592.3 | 7.9 | 37.4 | 58.4 | 488.6 |
| 5 | Arkansas | 579.4 | 7.3 | 70.0 | 38.6 | 463.5 |
| 6 | Louisiana | 519.8 | 10.8 | 33.7 | 39.4 | 436.0 |
| 7 | California | 486.0 | 4.5 | 36.6 | 119.1 | 325.8 |
| 8 | Colorado | 476.3 | 4.5 | 58.3 | 63.0 | 350.5 |
| 9 | Missouri | 462.0 | 7.8 | 45.2 | 51.5 | 357.5 |
| 10 | Kansas | 438.7 | 3.8 | 44.1 | 30.9 | 359.9 |
Data sourced from FBI UCR via Wikipedia aggregation and USAFacts verification. Note: DC is included as a high-density comparator despite not being a state.
Deep Dive: Alaska’s Extreme Challenges
Alaska tops state rankings with 724.1 violent crimes per 100,000 residents, over twice the national average. Aggravated assaults dominate at 513.0, fueled by rural isolation, substance abuse, and domestic violence in remote communities. High rape rates (122.1) correlate with underreporting in indigenous populations. Geographic vastness hampers policing, with response times exceeding hours in some areas.
New Mexico: Assault Epidemic
At 717.1, New Mexico’s profile features the highest aggravated assault rate (587.5). Homicides at 10.5 reflect border-related violence and gang activity in cities like Albuquerque. Economic disparity, with poverty rates above 18%, exacerbates tensions. State initiatives focus on community policing, yet clearance rates lag.
Southern Surge: Tennessee, Arkansas, and Louisiana
Tennessee (592.3) sees assaults at 488.6, linked to urban hotspots like Memphis. Arkansas (579.4) grapples with high rape (70.0) and assaults, amid rural poverty. Louisiana (519.8), with 10.8 homicides, battles New Orleans’ entrenched gang issues and post-hurricane recovery strains. These states share socioeconomic vulnerabilities.
Western and Midwestern Contenders
California’s 486.0 rate stems from robbery (119.1) in dense areas like Los Angeles. Colorado (476.3) faces rising assaults (350.5) tied to transient populations. Missouri (462.0) and Kansas (438.7) highlight Midwest struggles with urban decay and opioid crises driving violence.
Root Causes Behind the Numbers
- Economic Inequality: High-poverty states like New Mexico (18.2% poverty) correlate with elevated crime; limited jobs foster desperation.
- Urban Density and Gangs: Cities in California and Louisiana amplify robberies and homicides via gang territories.
- Substance Abuse: Alaska and Missouri report spikes in meth- and opioid-fueled assaults.
- Gun Prevalence: States with lax laws see higher homicide rates; Louisiana’s 14.4 per 100k exemplifies this.
- Policing and Justice Gaps: Low clearance rates (e.g., 40% for homicides nationally) erode deterrence.
Trends and Recent Developments
Despite high rates, 2024 marked declines: homicides dropped nationally, with Alaska and New Mexico showing modest improvements. However, property crimes surged in some areas, like New Mexico’s 2,751.1 rate. Emerging data for 2025 suggests continued volatility, urging proactive measures.
State-Specific Interventions
Alaska: Investments in tribal policing and telehealth for mental health.
New Mexico: Violence intervention programs targeting youth gangs.
Louisiana: Post-Katrina reforms emphasize community trusts and gun buybacks.
Federal grants via the CSG Justice Center support data-driven strategies across states.
National Comparisons: Safest States
| State | Violent Crime Rate (per 100k) |
|---|---|
| Maine | 100.1 |
| New Hampshire | 110.1 |
| Connecticut | 136.0 |
| Rhode Island | 153.6 |
| Wyoming | 203.4 |
These low-rate states benefit from strong community ties, effective policing, and economic stability.
Frequently Asked Questions
What constitutes violent crime in FBI statistics?
Violent crimes include murder, rape, robbery, and aggravated assault, reported per 100,000 residents.
Why do some states have higher rates?
Factors include poverty, urbanization, gun access, and policing challenges.
Are crime rates declining overall?
Yes, nationally down 5.4% in 2024, though high-rate states lag.
How can communities reduce violence?
Through targeted interventions, economic development, and justice reforms.
Is DC considered a state for these rankings?
No, but its rate (1,005.5) exceeds all states due to urban density.
Pathways to Safer Futures
Addressing violent crime demands multifaceted approaches: bolstering economic opportunities, enhancing mental health services, improving clearance rates, and fostering community-law enforcement partnerships. Data from the CSG Justice Center underscores that states adopting evidence-based policies see measurable gains. While challenges persist in top-ranked states, national declines signal potential for broader progress.
References
- List of U.S. states and territories by violent crime rate — Wikipedia (FBI UCR data). 2024. https://en.wikipedia.org/wiki/List_of_U.S._states_and_territories_by_violent_crime_rate
- Which states have the highest and lowest crime rates? — USAFacts. 2025-11-26. https://usafacts.org/articles/which-states-have-the-least-and-most-crime/
- Top 10 Most Dangerous States in 2023 — Morgan & Morgan. 2025-10-03. https://www.forthepeople.com/blog/top-10-most-dangerous-states-2023/
- 50-State Crime Data — CSG Justice Center (FBI statistics). 2024. https://projects.csgjusticecenter.org/tools-for-states-to-address-crime/50-state-crime-data/
Similar Articles








Read full bio of Sneha Tete