Common Car Accidents: 5 Crash Types And How To Avoid Them Now
Discover the leading causes of vehicle collisions, their risks, and practical strategies to stay safe on the road every day.
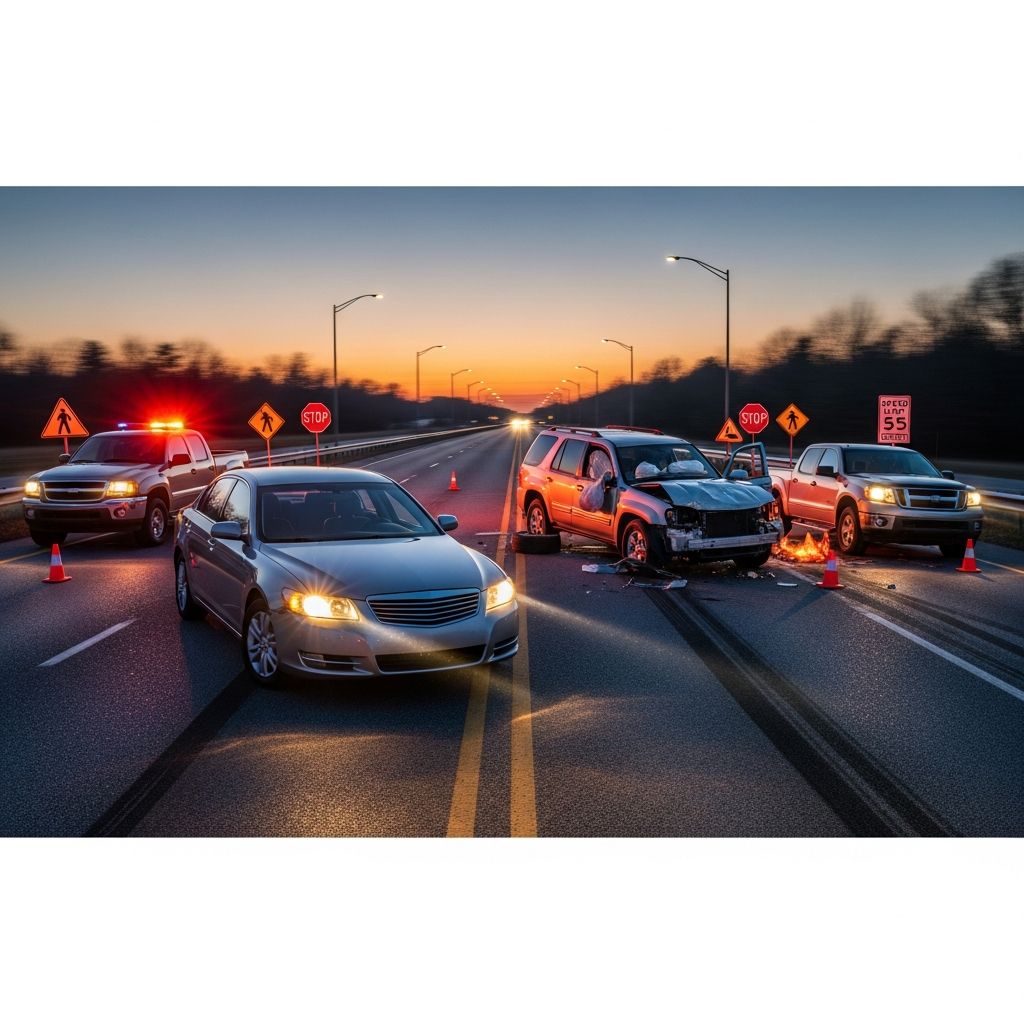
Vehicle collisions remain a leading cause of injury and death on U.S. roads, with millions reported annually. Understanding prevalent crash patterns empowers drivers to reduce risks through awareness and proactive habits.
Prevalent Collision Scenarios on Modern Roads
Statistics reveal distinct patterns in how crashes unfold, often tied to driver behavior at key moments like stops or turns. Rear-end impacts top the list, comprising about 29% of all incidents, frequently stemming from inattention or close following. These occur commonly in congested areas, leading to whiplash and soft tissue damage.
Intersections prove equally hazardous, accounting for 40% of crashes due to failures in yielding or signal violations. Side-swipe or perpendicular hits here amplify dangers, as vehicles have minimal crumple zones on flanks.
Rear-End Impacts: The Everyday Hazard
These collisions happen when a trailing vehicle strikes the one ahead, often at low speeds but with high frequency. Data from the National Highway Traffic Safety Administration (NHTSA) shows over 2 million such events in a recent year. Tailgating, phone use, or delayed braking are primary culprits.
- Common Triggers: Distracted scanning of dashboards or screens.
- Injury Profile: Neck strains from sudden jolts, back pain, and concussions if unrestrained.
- Prevention Tactics: Maintain a three-second gap, scan ahead continuously, and anticipate brake lights.
Adopting these reduces involvement by up to 80% in preventable cases.
Side-Impact Crashes: High-Risk Perpendicular Strikes
Known as T-bone accidents, these involve one car slamming into another’s side, often at junctions. They represent 13% of crashes but disproportionate fatalities due to poor side protection. Running reds or stop signs heightens odds.
| Crash Factor | Percentage | Key Risk |
|---|---|---|
| Intersection Failures | 40% | Severe side injuries |
| High Speeds | Common | Chest/pelvis trauma |
| Non-Yield | Primary | Fatal outcomes |
Victims face pelvic fractures, arm breaks, and internal bleeding. Counter this by double-checking cross-traffic and using signals early.
Head-On Collisions: The Deadliest Frontal Clashes
Less frequent at 22% but deadly, these pit vehicles front-to-front, often from lane drifts or wrong-way entry. Impairment or fatigue contributes heavily, yielding 10% of fatalities.
- Main Causes: Crossing centerlines, speeding opposites.
- Consequences: Catastrophic trauma, high mortality.
- Avoidance: Stay centered, pass safely, avoid night wrong-way risks.
Single-Vehicle Incidents: Solo Driver Perils
Running off roads or hitting fixed objects claims 26% of deaths, per National Safety Council data. Overcorrection, weather slips, or obstacles trigger these, representing 79% of injury crashes when multi-vehicle aren’t involved.
Teens and fatigued drivers feature prominently. Potholes, blowouts, or drowsiness lead to rollovers.
Leading Behavioral and Environmental Triggers
Human error drives most events: distraction (top cause), speeding, DUI, reckless maneuvers. Weather like rain or fog slicks surfaces, doubling night risks.
- Distracted Operation: Phones, eating; tops lists.
- Excess Velocity: Reduces reaction windows.
- Impairment: Alcohol/drugs cloud judgment.
- Fatigue: Nighttime drowsiness mimics intoxication.
- Signal Violations: Reds/stops ignored.
NHTSA surveys link interior distractions like conversations to many.
Injury Patterns and Long-Term Effects
Crashes vary in trauma: rear-ends yield strains; sides crush torsos; head-ons shatter frames. Fixed-object hits bruise via deceleration. Over 4.5 million injured yearly, with lifelong rehab for many.
Defensive Driving Techniques for Safety
Proactive measures cut risks sharply:
- Scan 12-15 seconds ahead.
- Buffer zones per speed (one car-length/10 mph).
- Minimize handheld devices; use hands-free.
- Rest every 2 hours on long hauls.
- Adjust for weather: slow, increase gaps.
Vehicle checks prevent mechanical failures like tire issues.
Legal Recourse After a Collision
Injured parties may claim compensation for bills, lost wages, pain. Fault hinges on negligence proof: witness accounts, cams, police reports. Consult attorneys early; statutes limit filing windows. Insurance battles common, but settlements average thousands for validated claims.
Contributory fault rules vary by state, reducing awards proportionally.
Frequently Asked Questions
What fraction of crashes are rear-end collisions?
Approximately 29%, per NHTSA, often from tailgating or distractions.
Why are side-impacts so lethal?
Limited side structure absorbs less energy, causing pelvic and chest injuries at speed.
How to avoid head-on risks?
Obey lanes, avoid passing near curves, stay sober.
Do single-vehicle crashes kill often?
Yes, 26% of fatalities involve fixed objects or rollovers.
What’s the top crash cause?
Distracted driving leads U.S. incidents.
Enhancing Road Safety Collectively
Beyond individuals, infrastructure like better signals and enforcement curbs patterns. Tech aids—automatic braking, lane alerts—gain traction, potentially slashing rates. Drivers must lead by example for fewer tragedies.
References
- Statistical Insight into Common Types of Car Accidents — Werner Hoffman. 2023. https://wernerhoffman.com/blog/statistical-insight-into-types-of-car-accidents/
- The Most Common Car Accidents and How to Avoid Them — Collier and Collier. 2023. https://collierandcollier.com/common-car-accidents/
- The 25 Top Causes of Car Accidents in the US — Serious Accidents. 2023. https://seriousaccidents.com/personal-injury-resources/top-causes-of-car-accidents/
- What Kinds of Car Accidents Happen Most Often? — DeMayo Law. 2023. https://demayolaw.com/faqs/what-are-the-most-common-types-of-car-accidents/
- Motor Vehicle – Type of Crash — National Safety Council. 2023-12-31. https://injuryfacts.nsc.org/motor-vehicle/overview/type-of-crash/
- National Motor Vehicle Crash Causation Survey — NHTSA. 2011-09-01. https://crashstats.nhtsa.dot.gov/Api/Public/ViewPublication/811059
Similar Articles








Read full bio of Sneha Tete