Top U.S. Cities and States for Distracted Driving Risks
Discover the U.S. cities and states with the highest rates of distracted driving, backed by recent data on crashes, phone use, and risky behaviors.
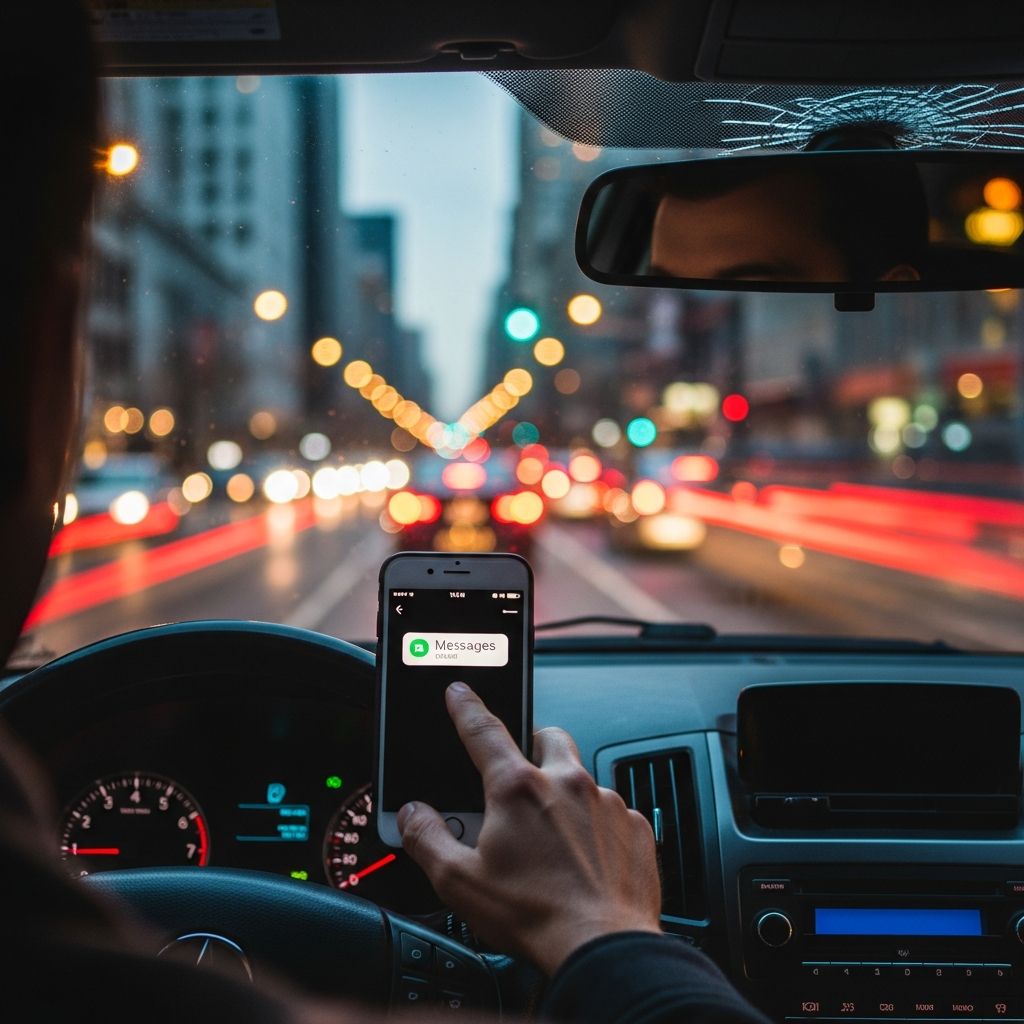
Distracted driving remains a leading cause of traffic accidents across the United States, with certain cities and states showing alarmingly high rates of behaviors like phone use, sudden braking, and rapid acceleration. Recent analyses from telematics data and national surveys reveal patterns that put drivers at greater risk in specific locations. Understanding these hotspots can help motorists stay vigilant and policymakers craft targeted interventions.
Understanding Distracted Driving and Its National Impact
Distracted driving encompasses any activity that diverts attention from the road, including texting, calling, eating, or adjusting navigation. According to federal data, it contributes to thousands of fatalities annually. In 2023, states reported over 10,000 deaths linked to such distractions, underscoring the urgency of addressing this epidemic. Behaviors like hard braking and speeding often signal phone engagement, amplifying crash risks.
Surveys indicate nearly 90% of drivers admit to some form of distraction, with phone-related activities being the most common culprit. Directions-checking tops the list of excuses, followed by calls and messaging. These habits not only increase personal danger but also elevate crash probabilities by four times compared to focused driving.
Cities Leading in Distracted and Aggressive Driving
Urban areas with heavy traffic and high smartphone penetration see the most distractions. A comprehensive study using over 60 billion driving data points identified California metros as particularly problematic due to frequent rapid acceleration, hard braking, and speeding.
- Riverside, CA: Tops the list for overall distraction indicators, with drivers exhibiting extreme acceleration and braking patterns.
- San Diego, CA: High rates of sudden stops and speed bursts make it a hotspot for erratic maneuvers.
- Phoenix, AZ: Noted for hard braking and rapid acceleration, contributing to elevated crash risks.
- Anaheim, CA: Mirrors California trends with aggressive driving prevalent among locals.
- Los Angeles, CA: Combines congestion with distraction, leading to frequent high-risk behaviors.
East Coast cities also rank poorly. New York City places second nationally for metro-area phone use, trailing only Miami, while Newark, NJ, follows closely. Florida cities like Tampa, Orlando, Miami, Jacksonville, and Fort Lauderdale dominate crash rankings, with the state holding the highest national crash rate.
State-by-State Breakdown of Distracted Driving Hotspots
At the state level, distraction scores derived from crash data, phone usage frequency, and self-reported behaviors paint a clear picture. New Mexico consistently ranks as the most distracted state, with a score of 76.85 out of 100 and the highest fatal crash rate per capita at 101.25 per 100,000 residents.
| Rank | State | Distraction Score | Fatal Crashes per 100K Residents | % Fatal Crashes Due to Distraction |
|---|---|---|---|---|
| 1 | New Mexico | 76.85 | 101.25 | 37.06% |
| 2 | Louisiana | 53.05 | High | 30.07% |
| 3 | Kansas | 48.04 | – | 30.03% |
| 4 | Kentucky | 47.23 | High | 18.25% |
| 5 | New Jersey | 38.63 | – | 28.80% |
Florida reports 277 distracted driving deaths in recent years, while California logs 146, despite its large population. New Jersey drivers use phones every 4.7 miles on average, the nation’s highest state rate.
Conversely, states like California, Nevada, and Michigan show lower distraction levels in some metrics, though California cities contradict this trend.
Gender Differences in Fatal Distracted Crashes
Data from the National Highway Traffic Safety Administration (NHTSA) highlights disparities. In Florida, 178 male and 73 female drivers were involved in fatal distracted crashes. California saw 107 males and 39 females. Nationally, males dominate these incidents, but females contribute significantly in certain states.
Common Distractions and Behavioral Trends
Beyond phones, drivers engage in risky acts like applying makeup (highest in Mississippi) and texting (worst in Hawaii). Nevada drivers report seeing the most phone use in others, while Alabama admits to the broadest range of distractions, with 45% average participation rate across behaviors. 72% of Alabama drivers confess to handheld calls.
California excels in aggressive acceleration, Florida in crashes, and North Carolina in hard braking. Distracted drivers speed four times more and hard brake 40% more often.
Legal Consequences and Enforcement Variations
Hawaii issues the most distracted driving tickets, while Wisconsin the fewest. All states ban texting, but handheld call laws vary. Penalties include fines up to $1,000 and license points. High-distraction areas like New Jersey enforce strictly due to elevated crash rates.
Prevention Strategies for High-Risk Areas
To combat this, drivers should use hands-free tech, pull over for navigation, and enable do-not-disturb modes. Apps tracking habits can promote accountability. Communities in top cities benefit from awareness campaigns and stricter enforcement.
Employers mandating safe driving policies reduce fleet risks. Public transit promotion in dense cities like Los Angeles eases phone temptations amid traffic.
Frequently Asked Questions (FAQs)
What city has the most distracted drivers?
Riverside, California, leads based on data from crashes, speeding, hard braking, and acceleration.
Which state reports the highest distracted driving deaths?
New Mexico, with 163 deaths in 2023 and 37.06% of fatal crashes involving distraction.
Are East Coast drivers more distracted than West Coast?
Yes, states like New Jersey and New York rank higher than most Western states, except California cities.
What is the most common distraction excuse?
Needing directions, cited by drivers nationwide.
How does phone use frequency vary by state?
New Jersey drivers use phones every 4.7 miles, the most frequent.
Conclusion: Driving Safer in a Distracted World
By recognizing high-risk cities and states—from Riverside’s acceleration frenzy to New Mexico’s fatal crash leadership—drivers can adopt proactive habits. Data-driven awareness saves lives amid rising distractions.
References
- These cities have the most distracted drivers in the U.S. — Time Out. 2025-05-14. https://www.timeout.com/usa/news/these-cities-have-the-most-distracted-drivers-in-the-u-s-051425
- New York City and New Jersey drivers are the most distracted — Rosenbaum Personal Injury Lawyers. 2024. https://www.rosenbaumnylaw.com/articles/new-york-city-and-new-jersey-drivers-are-the-most-distracted/
- America’s Most Distracted Drivers — CCD Law. 2024. https://ccdlaw.com/americas-most-distracted-drivers/
- States With the Least and Most Distracted Driving Accidents — Zutobi. 2025. https://zutobi.com/us/driver-guides/distracted-driving-report
- Distracted Driving Statistics by State (2026 Mercury Data) — Mercury Insurance. 2026. https://www.mercuryinsurance.com/resources/auto/distracted-driving-statistics-by-state.html
Similar Articles








Read full bio of Sneha Tete