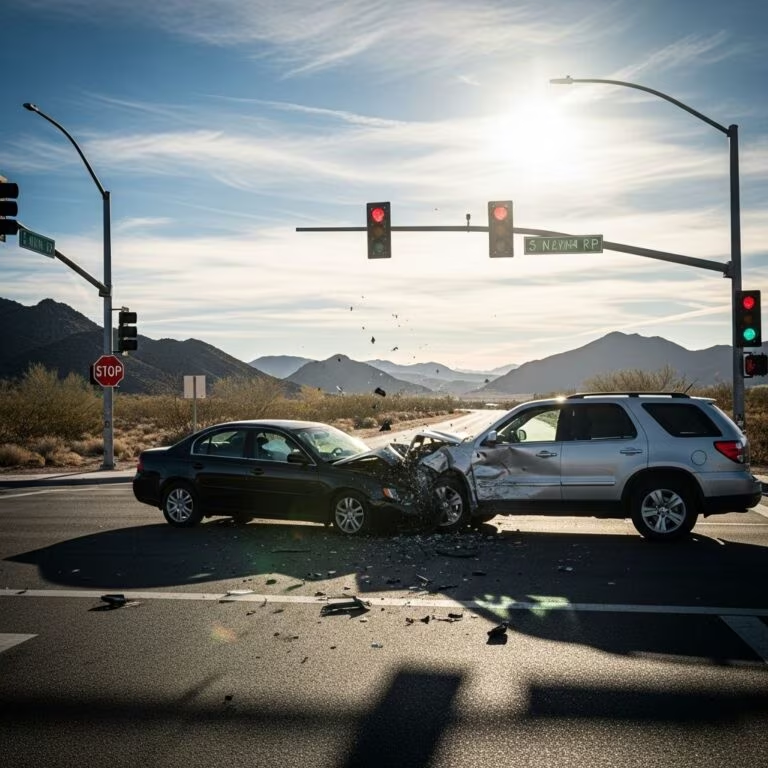
Public safety remains a cornerstone of urban life, with cities allocating significant resources to police and fire departments. Ratios of first responders per capita reveal how municipalities prioritize emergency services amid varying crime rates, population densities, and budgets. This article examines cities topping the charts for both police officers and firefighters relative to residents, drawing on recent data to highlight trends and implications.
Understanding Per Capita Metrics in Emergency Services
Per capita measurements—typically officers or firefighters per 10,000 or 100,000 residents—offer a standardized way to compare staffing across cities of different sizes. Larger metros often maintain higher ratios due to complex demands like traffic management and large-scale events, while smaller cities may focus on core patrols. Nationally, police departments in cities over 25,000 residents averaged 16.8 officers per 10,000 in 2016, with totals reaching about 667,000 officers by 2024. Fire service profiles similarly vary, influenced by call volumes for medical emergencies, which now dominate firefighter duties.
These metrics matter because they correlate with response times, crime deterrence, and disaster readiness. High ratios can signal robust protection but also raise questions about efficiency and taxpayer costs.
Top Cities for Police Officers Per Capita
Major urban centers dominate high police density lists, reflecting heightened security needs. Washington, D.C., and Chicago consistently lead among large cities, with D.C. boasting 70 officers per 10,000 residents—the nation’s highest. New York City follows closely at 42.3 officers per 10,000, supported by its NYPD’s 33,475 sworn officers as of October 2024.
| City | Officers per 10K Residents | Total Officers | Source Year |
|---|---|---|---|
| Chicago, IL | 43.9 | 11,954 | 2016 |
| New York, NY | 42.3 | 36,228 | 2016 |
| Atlanta, GA | 35.8 | 1,694 | 2016 |
| Los Angeles, CA | 24.6 | 9,850 | 2016 |
| Houston, TX | 22.2 | 5,182 | 2016 |
Metro areas like Lake Charles, LA (942 per 100,000), and Shreveport-Bossier City, LA (370 per 100,000) top recent 2025 rankings, often in regions with elevated crime or rural-urban mixes. States like Louisiana (30.8 per 10,000) and New York maintain high statewide averages, though challenges like vacancies persist.
Regional Patterns in Law Enforcement Staffing
The Northeast and South lead in police density. New York and Chicago exemplify big-city commitments, with NYPD and CPD ranking among the largest departments. Southern cities like those in Louisiana face unique pressures, including hurricane risks and urban violence, prompting dense staffing despite recruitment hurdles.
- Northeast: High in legacy cities like Rochester, NY (35.6 per 10K), due to historical investments.
- South: Louisiana metros dominate, with New Orleans at 300 per 100K.
- West: California varies widely; LA leads big cities, but places like Fremont lag at 7.6.
- Midwest: Kansas City, MO (28.3), shows strong mid-sized presence.
Smaller cities like Richmond, VA (30.6), punch above their weight, often due to targeted funding.
Firefighter Density: Protecting Communities from Flames and Beyond
Fire departments have evolved into all-hazards responders, handling 70-80% medical calls per NFPA profiles. While police data is more granular, firefighter per capita trends mirror urban demands. Cities with high police ratios often align with dense fire coverage, especially in fire-prone areas like California.
NFPA reports over 1 million firefighters nationwide, mostly volunteers in rural zones, but career firefighters concentrate in cities. High-density examples include:
- Northern cities like San Francisco and Boston, with robust departments for high-rises.
- Southern hubs addressing floods and industrial risks.
- Western metros battling wildfires, boosting seasonal staffing.
Per capita, expect overlaps with police leaders; e.g., D.C. and NYC maintain comprehensive fire services alongside law enforcement.
Cities Excelling in Combined First Responder Ratios
Standouts with elevated police and implied fire density include:
| City/Metro | Police per 10K/100K | Key Factors |
|---|---|---|
| Washington, D.C. | 70.0 per 10K | Capital security, federal overlap |
| Chicago, IL | 43.9 per 10K | Urban crime, large population |
| New York, NY | 42.3 per 10K | Global hub, tourism policing |
| Lake Charles, LA | 942 per 100K | Industrial hazards, small pop. |
| Atlanta, GA | 35.8 per 10K | Transportation nexus |
These locales invest heavily, often exceeding national averages by 2-3x.
Factors Driving High First Responder Ratios
Crime and Emergency Call Volumes
Elevated violent crime or EMS demands necessitate more personnel. Chicago’s staffing correlates with its challenges, while D.C.’s federal role amplifies needs.
Budget Allocations and Union Influence
Wealthier cities fund more positions; e.g., NYC’s massive NYPD budget. Unions advocate for ratios tied to service standards.
Geographic and Demographic Pressures
Dense populations, tourism, and hazards like wildfires drive staffing. Louisiana’s ratios reflect disaster prep.
Post-Pandemic Shifts
National officer counts rose slightly to 666,990 by 2024, but vacancies linger in high-density states.
Implications for Residents and Policy
High ratios promise quicker responses—critical for life-saving interventions—but can inflate taxes. Low-ratio cities like Seattle (98 per 100K) face criticism over delays. Balancing is key: optimal staffing deters crime without excess.
Residents in top cities benefit from visible patrols and rapid fire response, fostering security. However, overstaffing risks complacency, while understaffing breeds burnout.
Challenges in Maintaining High Density
- Recruitment Shortages: Louisiana declared emergencies over vacancies.
- Budget Strains: Inflation erodes funding.
- Retention: Competitive pay in cities like San Diego aids.
Future Trends in Public Safety Staffing
Tech like body cams and AI analytics may optimize ratios. Drones and predictive policing could reduce personnel needs in some areas. Climate change boosts fire demands in the West. By 2026, expect Louisiana and Northeast to retain leads amid national growth.
Frequently Asked Questions (FAQs)
What city has the most police per capita?
Washington, D.C., leads with 70 officers per 10,000 residents, driven by its capital status.
Why do some cities have higher firefighter ratios?
Urban density, industrial risks, and medical call surges necessitate more career firefighters.
Has police staffing increased recently?
Yes, from 665,280 in 2019 to 666,990 in 2024 nationally.
Are high ratios always better?
Not necessarily; efficiency depends on deployment, training, and community trust.
Which states top police density?
District of Columbia, Louisiana, New York, and Mississippi.
References
- Police Employment, Officers Per Capita Rates for U.S. Cities — Governing.com. 2016. https://www.governing.com/archive/police-officers-per-capita-rates-employment-for-city-departments.html
- List of Largest Local Police Departments in the United States — Wikipedia (data from official reports). 2024-2025. https://en.wikipedia.org/wiki/List_of_largest_local_police_departments_in_the_United_States
- Best and Worst Cities for Police in 2026 — Security.org. 2025. https://www.security.org/resources/best-worst-cities-police/
- 2022 Police Employment Statistics — SafeHome.org (FBI data). 2024. https://www.safehome.org/resources/states-with-most-police/
- The Best-Paying Cities for First Responders — KSJB AM 600. 2021. https://www.ksjbam.com/2021/09/30/the-best-paying-cities-for-first-responders/
- U.S. Fire Department Profile Report — NFPA Research. Recent. https://www.nfpa.org/education-and-research/research/nfpa-research/fire-statistical-reports/us-fire-department-profile