Drive Sales: In-Store vs Online Strategies
Master proven tactics to guide customers toward in-store purchases or seamless online transactions for maximum revenue growth.
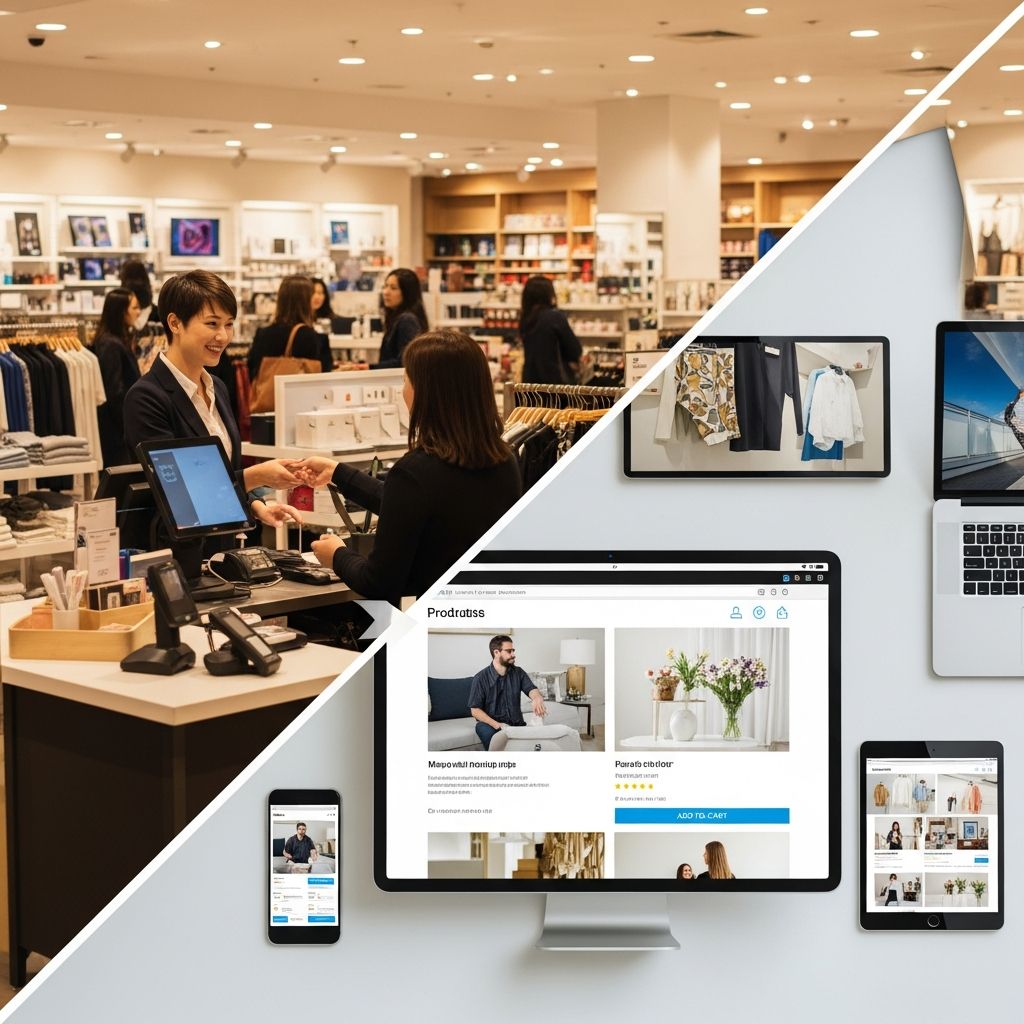
Retailers today face a dynamic landscape where customers fluidly shift between physical stores and digital platforms. While online shopping surges, in-store experiences retain strong appeal, with 40% of consumers making weekly in-store purchases compared to 27% online. Small businesses must craft targeted approaches to direct traffic where it yields the highest returns, balancing convenience with tactile engagement.
Current Retail Landscape: Physical vs Digital Dominance
In 2025, U.S. consumers spent approximately $5.927 trillion in brick-and-mortar stores versus $1.337 trillion online, underscoring physical retail’s enduring strength despite e-commerce growth. E-commerce accounts for 16.4% of total U.S. retail sales as of Q4 2024, with projections for global sales reaching $6.88 trillion by 2026. Yet, 44% of shoppers prefer in-store retail when paired with digital tools.
Generational divides shape preferences: 67% of millennials favor online channels, while 72% of seniors opt for stores. Gen Z splits evenly at 52% online versus 48% in-store. Overall, 59% lean online by mid-2025, but 41% stay loyal to physical locations. These trends highlight the need for hybrid models.
Key Factors Influencing Buyer Channel Choices
Consumers weigh multiple elements when deciding between channels. Online excels in accessibility, with 81% researching products digitally before any purchase. In-store shines through sensory interaction, vital for 47% who value easy comparisons and 48% seeking convenience.
| Factor | Online Advantage | In-Store Advantage |
|---|---|---|
| Convenience | Anytime access, no travel | Immediate possession |
| Selection | Unlimited inventory | Curated, hands-on displays |
| Pricing | Competitive deals | Impulse promotions |
| Experience | Reviews and visuals | Touch, try, consult staff |
| Returns | Home-based process | Instant exchanges |
This comparison reveals online’s edge in research (over 80% use social media pre-purchase) and in-store’s superiority for complex items like furniture or beauty products.
Powerful Tactics to Boost In-Store Foot Traffic
- Exclusive In-Store Perks: Offer members-only discounts or early product access to draw crowds, capitalizing on the 23% who research online but buy in-store for holidays.
- Immersive Events: Host demos, workshops, or tastings to leverage tactile appeal, especially for food and apparel where physical trials boost conversions.
- Localized Marketing: Use geofencing ads to target nearby users, reminding them of instant gratification unavailable online.
- Staff Expertise: Train teams for personalized advice, addressing the real-time service gap in digital channels.
- Store Refresh: Update layouts with interactive zones to combat the 18.5% growth in physical retail.
These methods tap into the social aspect, turning shopping into an event that online cannot replicate.
Optimizing Online Sales Channels for Growth
To compete, enhance e-commerce with user-friendly designs. Mobile commerce will drive 46% of sales in 2025, totaling $3.2 trillion globally. Focus on:
- Frictionless Checkout: Integrate digital wallets, which handled 49% of 2021 transactions, and one-click buys.
- Rich Visuals: Use 360-degree views and videos to mimic in-store trials, crucial since 70% research via mobile before in-store buys.
- Personalization: AI recommendations based on browsing history increase average order value by 7% year-over-year.
- Fast Shipping: Partner for same-day delivery to close the immediacy gap.
- Social Commerce: 70% buy directly from platforms where 30% purchase same-day discoveries.
Categories like electronics (37% online preference) and apparel (35%) thrive digitally.
Building a Seamless Omnichannel Retail Experience
The future lies in integration: 63% of journeys start online regardless of endpoint. Enable buy-online-pickup-in-store (BOPIS), which surged post-2020. Use unified inventory systems for real-time stock views across channels. Loyalty programs syncing rewards boost retention, as 75% shop online monthly worldwide.
Retailers blending channels see higher lifetime value. For instance, mobile research precedes 70% of in-store purchases, making apps bridges between worlds.
Data-Driven Insights from 2026 Retail Trends
Projections show e-commerce at $8.1 trillion globally by 2026, yet physical stores grow faster at 18.5% versus 14.2% online. Black Friday 2024 hit $10.8 billion online, Cyber Monday $13.3 billion with 57% mobile. Offline, malls see rising traffic into 2026.
Top online categories include consumer electronics ($922.5B–$988B), fashion ($760B–$920B), and food ($708.8B). Small businesses should prioritize high-margin tactile goods for stores and commoditized items online.
Common Pitfalls and How to Avoid Them
Avoid siloed channels: disjointed experiences lose 52% of Gen Z. Over-discounting online erodes in-store value. Instead, use analytics to track cross-channel behavior, adjusting based on 42% holiday online researchers. Ensure mobile optimization, as conversion lags at 1.6% versus desktop 2.8%.
Frequently Asked Questions
What percentage of consumers prefer online shopping in 2025?
Approximately 59% prefer online, while 41% choose in-store.
Which generations favor physical stores?
Seniors (72%) and half of Gen Z (48%) prefer in-store shopping.
How can small businesses increase in-store traffic?
Implement exclusive perks, events, and geofencing to leverage sensory advantages.
What drives online sales growth?
Mobile commerce (46% of sales) and social buying, with $13.3B on Cyber Monday 2024.
Is omnichannel essential for 2026?
Yes, as 63% of journeys begin online, demanding seamless integration.
Actionable Steps for Immediate Implementation
- Audit current channels for friction points using customer feedback.
- Launch a BOPIS program to capture hybrid shoppers.
- Invest in staff training and store events quarterly.
- Optimize website for mobile with personalized tools.
- Track metrics like foot traffic and conversion rates weekly.
By aligning strategies with these insights, small businesses can capture both digital convenience seekers and experience cravers, driving sustainable growth in a $7.4 trillion U.S. market.
References
- 25 Popular In-Store vs Online Shopping Statistics — Mailmodo. 2026. https://www.mailmodo.com/guides/in-store-vs-online-shopping-statistics/
- Online vs In-Store Shopping: What’s Changed in 2026 — Business.com. 2026. https://www.business.com/articles/retail-or-e-tail-buying-online-vs-buying-in-person/
- 70 Latest e-commerce statistics (New 2026 data) — WiserReview. 2026. https://wiserreview.com/blog/ecommerce-statistics/
- Retail Industry Trends for 2026 — Luxer One. 2026. https://www.luxerone.com/retail-industry-trends-for-2026/
- 2026 Online Shopping Statistics — OptinMonster. 2026. https://optinmonster.com/online-shopping-statistics/
- 10 trends and predictions for retail in 2026 — NRF. 2026. https://nrf.com/blog/10-trends-and-predictions-for-retail-in-2026
Similar Articles








Read full bio of Sneha Tete